
Imaging in the age of AI: form and function, computed at scale
This post was originally written for my friend Trevor Atkeson’s Substack ‘GxE’ and is linked here.
Hi, I’m Felix. I’m a cancer cell biologist and submitted my PhD last week (woo!). I’m interested in how the observable characteristics of cancer cells, known as their phenotype, help explain why a therapy might succeed or fail. I study this by capturing and analysing beautiful images of cells, which is what I’ll be talking about today.
Form and function are intimately linked in biology. Form describes the physical structure of something, its shape, size and the organisation of its parts. Function is the behaviour that structure produces. This relationship is evident across all biological scales. The twisted three-dimensional assembly of a protein specifies which molecules it can bind, the shape and organisation of gut cells selectively absorb nutrients, and the sleek torpedo-like physique of a fish allows it to glide effortlessly through turbulent waters. At the cellular level, functional behaviour is inseparable from the spatial organisation of molecules. Yet most modern sequencing technologies (the sexy tools used to measure the molecular contents of individual cells) completely obliterate that organisation. Imagine a cell is a strawberry. Now put it through a blender and try to understand the original fruit by counting its seeds. Everything that made it a strawberry is now juice. You’re analysing juice and hoping to understand strawberry. Who thought that was a good idea?
To properly understand cells, we need tools that preserve their organisation. Cells are small, each of us contains around 30 trillion. Revealing their private lives requires quite a close view.
Luckily, ~400 years ago, a gaggle of nerdy Europeans tinkering with sculpted pieces of glass invented the first microscope. During the Enlightenment, these bleeding-edge instruments fuelled the systematic characterisation of otherwise invisible worlds. Fleas, lice, moss, and mould were laid onto cold glass stages as beams of focused light revealed their every inch. Robert Hooke first used the term ‘cells’ in 1665 while describing the microscopic structure of cork. He saw rows of tiny compartments (the empty walls of dead plant tissue), reminiscent of the confined rooms of a monastery. A few years later, Antonie van Leeuwenhoek described the first living cells; bacteria, sperm, and red blood cells swimming in drops of water and self-served bodily fluids.
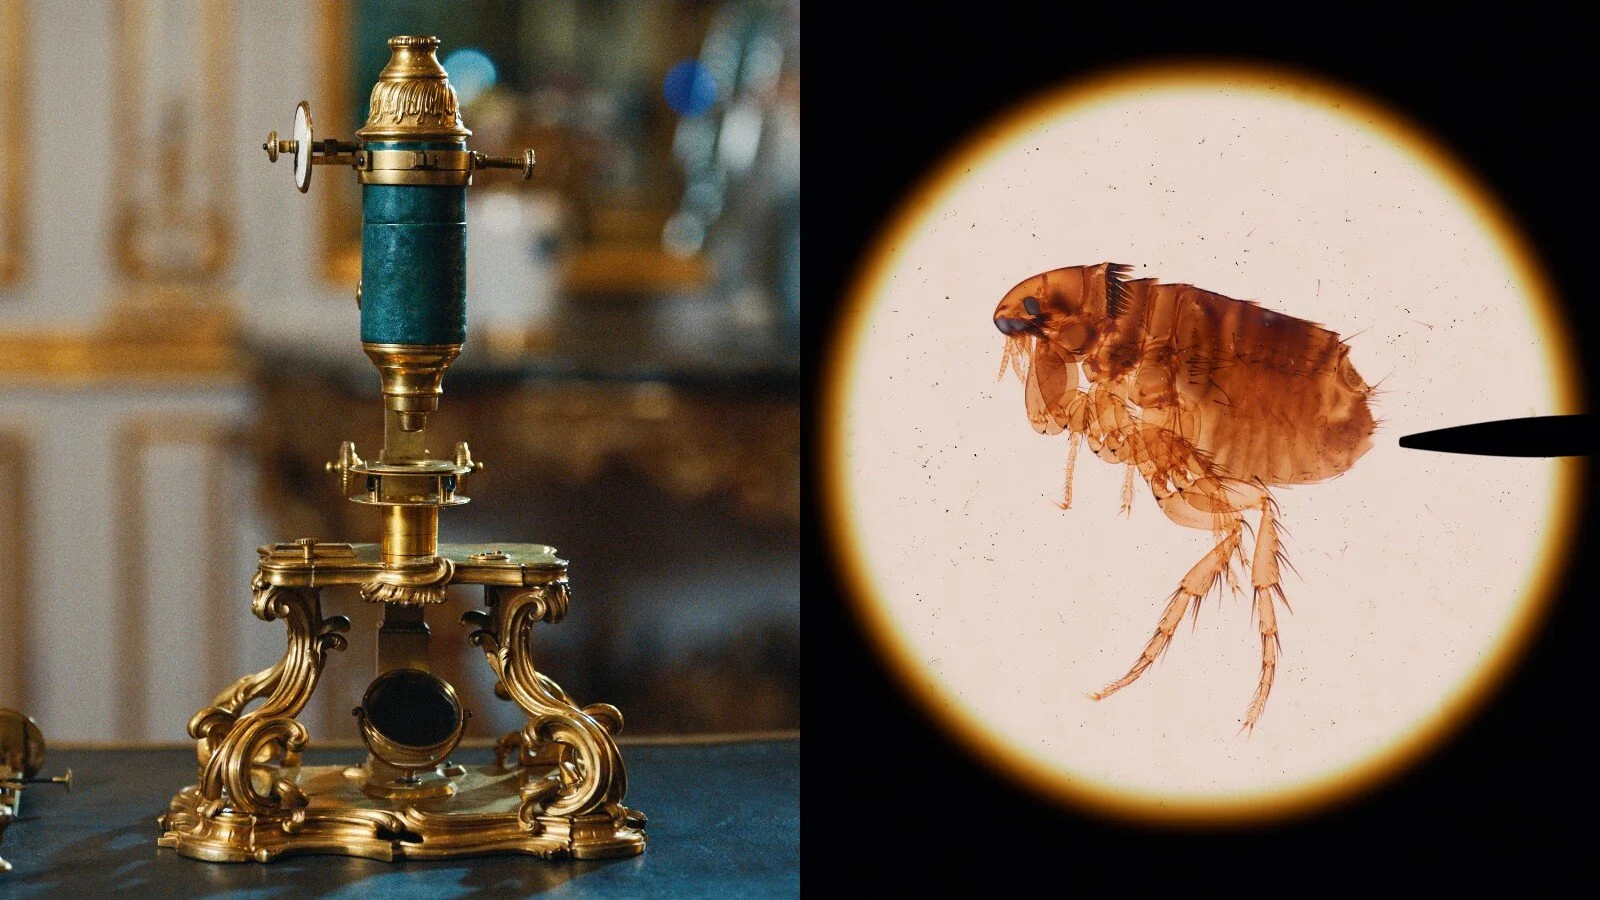
A beautiful gilded French compound microscope from the 1750s alongside a cat flea specimen. Part of an exhibition I stumbled into last year at the Getty Museum in LA.
These early descriptions revealed that life is built from discrete, organised units, which were later called ‘cells’. Over time, scientists uncovered not only what cells looked like, but also how their internal organisation (the positioning of their parts) gave rise to their complex behaviours. Of course neurons transmit electrical pulses, they look like a tangle of wires. And obviously ciliated cells sweep dust from airways, they are literally capped with broom heads.

Sweeping broom heads of ciliated cells, source.
These are clear examples, but let's move a little further into my field of cancer. Cancer arises when a cell forgoes its normal duties, entering a state of continued growth that ultimately forms a tumour. What can imaging teach us about this?
Cells can be understood through many metaphors. Trevor used the analogy of a kitchen in his last post. ~20 lines ago I used a strawberry (admittedly not one of my finest). I’ve heard cells as factories, cars, computers (a personal favourite), parties, houses, and more. One metaphor that may help us here is to envision a cell as a city.
If a cell were a city, the cytoskeleton would be its roads, vesicles the cargo‑laden delivery vans, and each organelle (mini organs within the cell) a landmark building: the nucleus as town hall, ribosomes as factories, mitochondria as power stations, and the Golgi as the postal depot. Now, imagine we tried to understand this city by running a “sequencing census”. We’d get a detailed spreadsheet listing how many kilometres of road are laid, how many vans are on shift, and how many of each building type sit within the city limits on a particular day. What we’d miss entirely are the relationships between these parts and their activity over time.
Instead let's take a satellite view. With a wide-angle image we can trace the major traffic flows, detect neighbourhoods suffering blackouts, and pick out dense suburbs such as the nucleus or the freight lanes circling the Golgi where cargo is sorted. Rush hour turns quiet streets into streams. A lane closure diverts traffic through side roads. A festival fills the parks. Zoom in further, and we can follow individual commuters. A protein leaving the city’s outskirts rides in a vesicle through intersecting roads before arriving at the town hall to clock in for the day (influencing gene expression). Over time, patterns emerge. Repeated visits to the same building hint at a regular job or routine. Carpooling suggests a close working relationship: molecular complexes, functional pathways.

Cells as cities. Left: Satellite image of the well-designed city of Melbourne taken by astronaut Tim Kopra. Right: widefield microscopy image of breast cancer cells labelled with a cell adhesion protein (red) and a cytoskeletal protein (green) taken by me.
Healthy cities are well-designed. Roads are maintained, waste is collected, power is stable, and emergency services arrive when needed. Disease corrupts that organisation. Cancerous cities are chaotic. Broken traffic lights, endless construction zones, and resources diverted to runaway building projects. The success of any intervention project depends on the current state of the city. A drug designed to block a busy road will only work if an exit lane hasn’t already been built.
Leaving metaphors behind, how has the 17th-century science of microscopy entered the single-cell era? Images capture an enormous amount of information which can be used to predict the health of a cell, whether it's stressed, diseased, or responding to a drug. One popular method for revealing this information is Cell Painting. This cheap and simple technique involves labelling with fluorescent dyes that highlight six different cellular compartments. High-resolution images captured by automated microscopes are fed into algorithms that extract thousands of features from individually segmented cells (see below, right-most panel). These capture the size, shape, brightness, texture, and spatial arrangements of each compartment in each cell. It’s like Robert Hooke’s descriptions of cork but on anabolic steroids. These features build a rich description of the observable state of each cell, its phenotype. The image below shows how Cell Painting reveals phenotypes induced by genetic perturbation. Untreated vascular cells (top row) are small, clustered and cuboidal, whereas silencing a gene (bottom row) causes them to swell in size and break from their neighbours. This suggests that the gene in question has some relationship to cell size and adhesion; function is inferred through form.
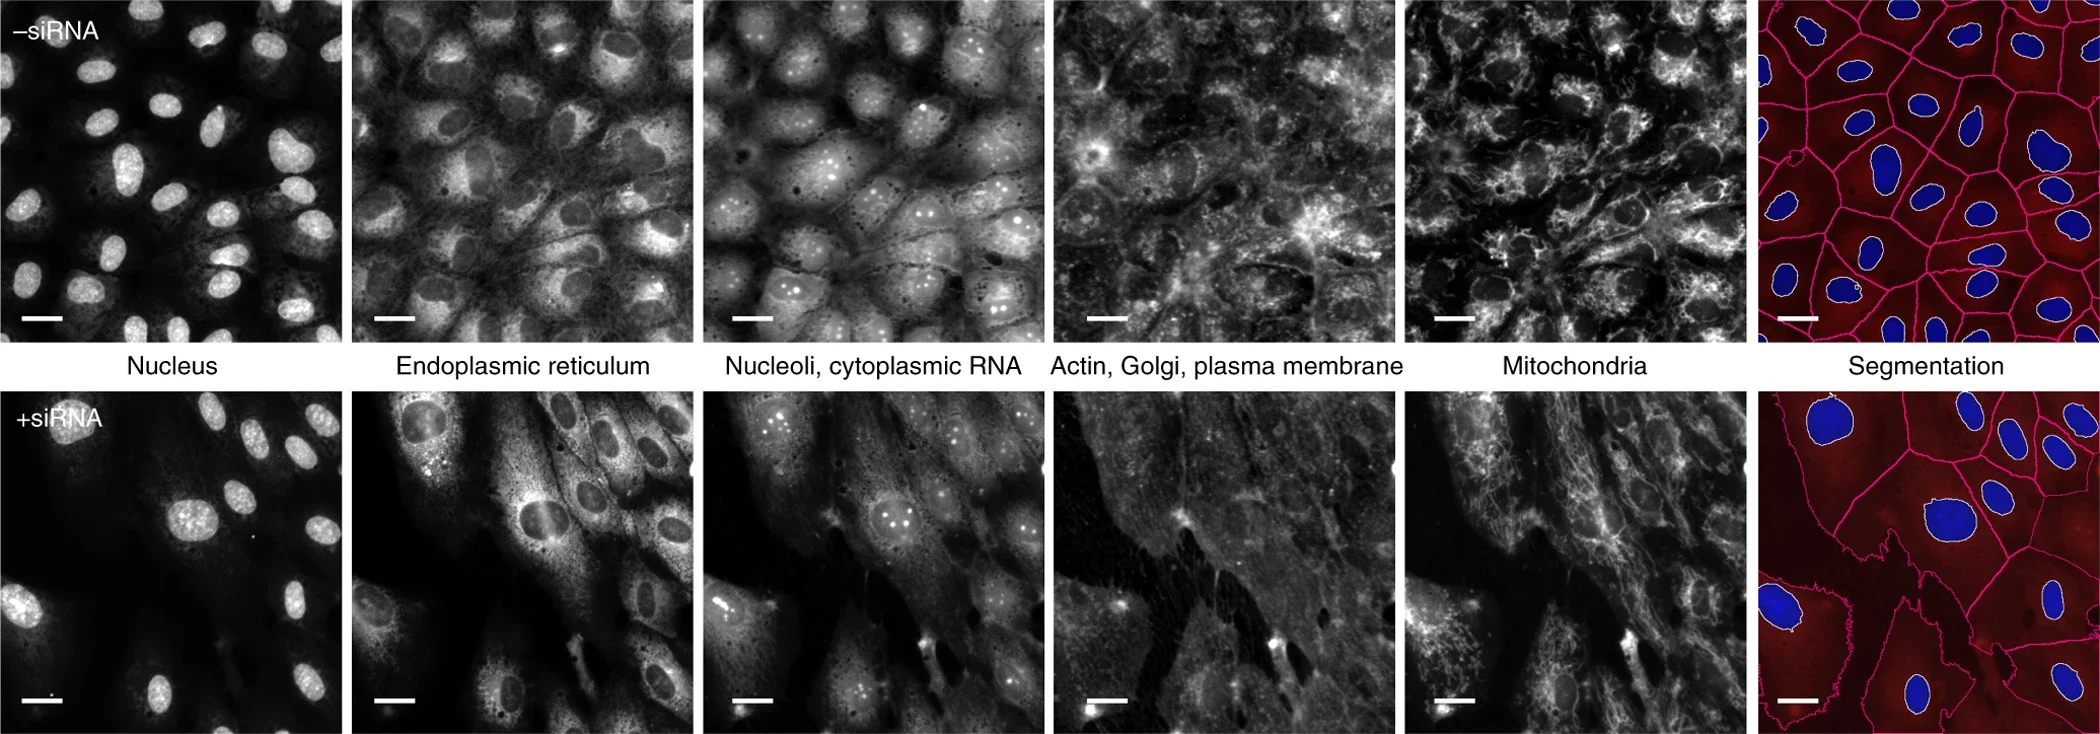
Cell Painting assay and single-cell analysis, source.
One of the most exciting uses of imaging is in drug discovery, and one of the most ambitious companies in this quest is Recursion. The company scaled Cell Painting to industrial levels, automating the entire process from compound screening, labelling, imaging, and analysis. It was also among the first to integrate artificial intelligence (AI) to accelerate their efforts. The approach is simple: expose cells to a newly designed or repurposed drug, image them using Cell Painting, and repeat across billions of combinations involving genetically diverse cell lines, patient-derived models, chemical compounds, and genetic perturbations. Each image is mined for phenotypic features, which are then used to train AI models to detect meaningful patterns in how cells respond.
The goal for these models is to learn the relationship between three elements: the initial state of the cell (its baseline phenotype, informed by Cell Painting, as well as sequencing and clinical data), the treatment applied (such as drug structure or genetic perturbation), and the resulting response (its phenotype after treatment). By modelling these as a structured mapping (state × treatment × response), AI models uncover the hidden links underlying their interaction. Two paragraphs ago we predicted that a gene influences cell size and shape by comparing images of cells with and without its activity. This is exactly what AI algorithms do but massively paralleled over billions of predictions that our soft brains can’t match. Form and function computed at scale.
This framework supports a range of powerful applications. New drugs can be screened by comparing response profiles to those of existing drugs with known mechanisms (our lab took this approach for screening cancer drugs). This can reveal hidden modes of action, generate better and cheaper alternatives, or flag for likely side effects. With enough data it even becomes possible to predict the effects of drugs that have never been tested in the lab. In silico (meaning in silicon, or entirely using computers) screening of millions or even billions of compounds can dramatically narrow candidate selections before committing to costly and ethically sensitive lab experiments. Recursion recently showcased this by predicting the targets of 36 billion compounds using machine learning and AlphaFold-derived protein structures.
While promising, the clinical success of these approaches is still unproven. Recursion has yet to bring a drug to market. Their stock is down 80% since IPO, and they recently fired a fifth of their workforce. Their first AI-nominated candidate (identified during the CEO’s PhD) failed to show efficacy in a Phase 2 trial. The outcomes of other drugs developed through the full capabilities of their current platform remain to be seen. They’re early adopters leading an incredibly unfavourable market by a long shot. I remain bullish.
Automation has enabled the development of commercial labelling and imaging products at a scale and standard that were previously reserved for sequencing platforms. Next-gen spatial sequencing technologies are a powerful push in this direction: deep molecular coverage of cells in their natural environment. As with all new tech, costs remain prohibitive. Increasing molecular readouts may not even be necessary. Recursion recently announced a shift away from the protein labelling of Cell Painting into a primitive form of unlabelled imaging known as brightfield. AI models trained on brightfield images (below, left) could accurately generate fake Cell Painting images (below, middle), which provided just as much predictive power as the real counterparts (below, right). Brightfield microscopy is the exact same tool used by those 17th-century nerds. These cheap instruments sit modestly in every biology lab around the world, offering a profound example of how AI can extract information from where humans cannot. Dust coated optics shepherded into modernity.

Imaging not only provides access to the information critical for cell biology, but also compels the creativity necessary to interpret it. Generated ‘data’ moonlight as striking pieces of visual art (see the NHMRC’s Art of Science awards). It encourages you to notice patterns and provides immediate feedback between your data and the sources it was extracted from. Treatment effects emerge in front of your own eyes, which can then be interrogated during analysis, or vice-versa. This is a property unique to any other form of biological data. Grab a microscope, camera, or phone and get to analysing. ;)
Additional links:
In-depth article on Recursion’s switch to brightfield imaging.
Books by Siddhartha Mukherjee, one of my favourite science writers. All are excellent. The Song of the Cell is most relevant (a history of cell theory), but The Emperor of All Maladies is my favourite (a history of cancer).